This week’s blog post is a little different. I’m working with a resort to use AI to improve how work gets done, and I’ll share our progress along the way—including the parts that have very little to do with AI.
The resort has guest rooms, meeting space, restaurants and a spectacular spa. There are plenty of places to start.
The goal is to automate and augment work across departments to grow sales and profit. My job also includes teaching people on property how to build, maintain and improve these systems themselves. When I move on, the knowledge needs to stay.
My main partner’s background is in marketing, and he recently took over the sales team. That’s where we started.
First, what are we working toward?
I spent several days on site assessing systems and talking with the teams. I also trained the salespeople to use ChatGPT for prospecting: researching segments, building buyer personas, finding leads and drafting outreach.
The biggest discovery wasn’t about AI. The salespeople couldn’t tell me their individual sales targets.
Before we could decide what to automate, we needed to make those targets clear—and give everyone a way to see how they were doing.
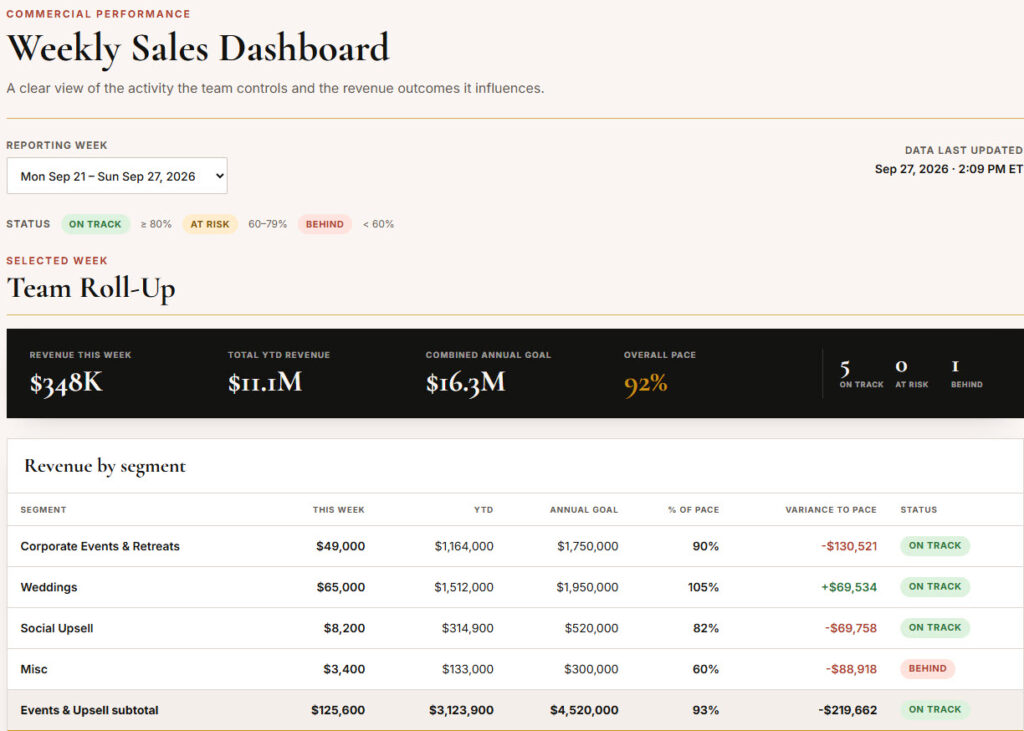
So our first project became a sales dashboard.
Week one: homework and a spreadsheet
I assigned my partner three introductory Claude videos, since we’d be using it for some of the building.
Then I gave him a simple spreadsheet and asked him to meet with every salesperson. Together, they would identify two things:
- Activities: What does this person do to generate or grow business?
- Results: What revenue are they responsible for, and how will we know whether they’re on track?
For every measure, he also needed to identify the data source: sales and catering, reservations, accounting—or something someone would have to enter.
That exercise alone taught us a lot. He came back with answers, more questions and concerns about the whole marketing-to-booking process.
We started a parking lot for issues worth addressing later. Otherwise, our first dashboard could easily have become six projects.
Build it with the people being measured
A dashboard can feel like useful feedback or like surveillance.
People need a say in whether the measures reflect their jobs, what obstacles affect their results and how leadership will use the information. Those conversations helped us understand the work before we started counting it.
They also reinforced that different roles need different activity measures. A wedding seller, a corporate seller and an upsell planner don’t spend their days doing the same things.
Everyone needs a clear connection between their work and revenue. That doesn’t mean giving everyone an identical scorecard.
A measure we’re testing: revenue per touchpoint
One wedding involved 345 email touchpoints. Some couples needed three site tours.
That’s a lot of attention. But the wedding also represented more than $100,000 in revenue.
It raised an interesting question: how much work does different business require?
We’re testing revenue per touchpoint as one starting point. It has limitations: an email isn’t the same effort as a site tour, revenue isn’t profit, and looking only at business that closes misses the work spent on business we lose.
So this is an experiment. We want to see whether it helps us identify processes that deserve a closer look.
Every metric had to earn its place
The temptation was to track EVERYTHING.
Instead, we aimed for roughly 10 measures per person, asking one question about each:
What would we do differently because we knew this number?
The first version combines role-specific activities, pipeline measures and revenue results. Depending on the role, that includes prospecting, site tours, inquiry response time, signed business and progress toward revenue goals.
The definitions matter, too. Revenue contracted this week and revenue from events that have already happened answer different questions. Goals and pace comparisons need to use the same basis as the numbers we’re measuring.
Automate what we can. Keep the rest quick.
Once we knew what we wanted to measure, we met with the vendors holding the data, starting with the sales and catering provider. We asked about API access—a way for the dashboard to pull information directly from the system.
For the first build, I took the lead using Claude, documenting the process so my partner could learn from a working example. The plan is for him to lead the next one.
We now have an initial dashboard, with system connections still being added. Leadership gets a team view of revenue, pipeline and trends.
For activities the systems don’t capture, such as networking events, we’ve designed a short weekly submission: an automated Friday email, a private link, and a few numbers due Monday morning.
There’s still some manual input. The goal is to make it small enough to become a sustainable habit.
Next: a useful first response
Our next project addresses inquiry responses, where the average wait was days rather than hours.
We’re designing a reply shaped by the information in each inquiry, with options to connect with the salesperson.
But sending an instant thank-you is only part of the job. We also need to understand whether the reply helps the buyer move forward—and how quickly a salesperson follows through.
That’s the next experiment. I’ll share what we learn.
What I’d carry into any hotel’s first project
Agree on the goal before automating the work. Involve the people affected. Find the data sources early. And give every metric a reason to exist.
We started with AI, but a lot of the useful work so far has come from conversations about expectations, responsibilities and how business moves through the hotel.
If you asked every seller on your team for their target—and whether they’re on track—how consistent would the answers be?